Simulation results
An example of light curve for PKS1622-296 simulated with obsim and
analyzed with the Likelihood package is shown
below. The time runs over 30 days, each point corresponding to a
one-day period The upper panel displays
the found power-law index, the input index being constant and
equal to -2.

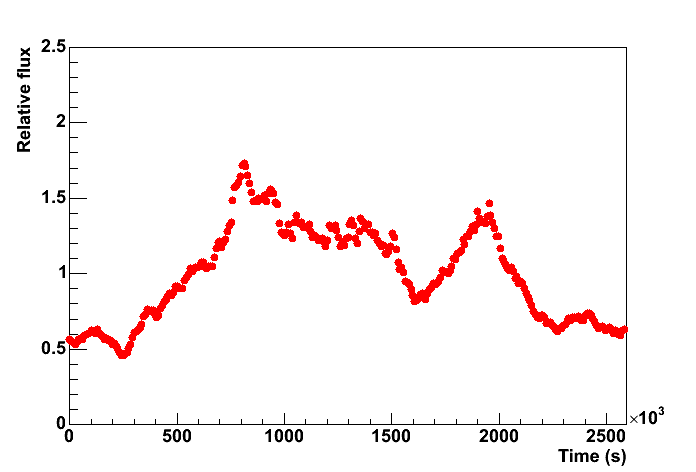
The lower panel represents the light curve to be compared
with the input one (provided by J. McEnery),
displayed in
the following figure (in arbitrary units). The input average flux
(E>100 MeV) is 52 10-8 cm-2s-1 ,
i.e. comparable
to the average flux observed with EGRET (47.4 10-8 cm-2s-1).


