Demonstrator_RMS2.C
Example of a ROOT macro that computes the average samples and the RMS for all channels, from aTPC demonstrator run file.
* [ROOT] .L Demonstrator_RMS2.C
* [ROOT] PlotDemonstrator_RMS2 ( "../../data/Demonstrator/run_baseline.dat", 0, 0, 1, 17 );
*
The processing is done by the functions from the GETRoot library.
//======================================================================
// ROOT macros for TPC Demonstrator system
// - read a test file (2 CoBo modules / 8 AsAd)
// - compute mean sample for all channels
// - compute RMS sample for all channels
// - display result for 1 channel
//
//======================================================================
/*
These macros require to load the GET libraries
gROOT->Macro ( (getenv("GET_BASE")+string("/root/GETRootLibs.C")).c_str() );
To execute the macro
.L Demonstrator_RMS2.C
PlotDemonstrator_RMS2 ( "../../data/Demonstrator/run_baseline.dat", 0, 0, 1, 17 );
*/
//----------------------------------------------------------------------
// This function reads all events from a TPC demonstrator run file
// (a baseline run).
// For all channels, it creates the average signal.
// The the file is read a second time to compute the RMS of the
// signal.
//
// The average and the RMS are computed using functions from the
// GETRoot aditionnal library.
//
// The result is plotted for one channel.
void PlotDemonstrator_RMS2 ( const string & data_file,
u_short cobo_id,
u_short asad_id,
u_short aget_id,
u_short chan_id )
{
GSetVerboseLevel(3);
getProcessedInfoCount = 5;
// create the GET system
u_short ncobo = 2; // 2 CoBo modules (TPC demonstrator)
u_int n = 512; // 512 samples / channel
double dt = 0.01; // 0.01 us sampling time
GETSystem gDem(ncobo,n,dt);
// get the reference for the channel to plot
GETSample & sample_out = gDem[cobo_id][asad_id][aget_id][chan_id].OutSample();
//------------------------------------------------------------
// Compute the average for all channels
cout << endl
<< "Computing averages" << endl;
cout << endl
<< "Number of events read: " << nr << endl
<< endl;
if (nr > 0)
{
// memorize the sample for the channel to plot
// (the data in gDem object will be overwritten when computing RMS...)
GETSample sample_mean ( sample_out );
//------------------------------------------------------------
// Compute the RMS for all channels
cout << "Computing RMS" << endl
<< endl;
// call GET/ROOT function to build RMS samples, with respect
// to current content of the channels (mean values)
//------------------------------------------------------------
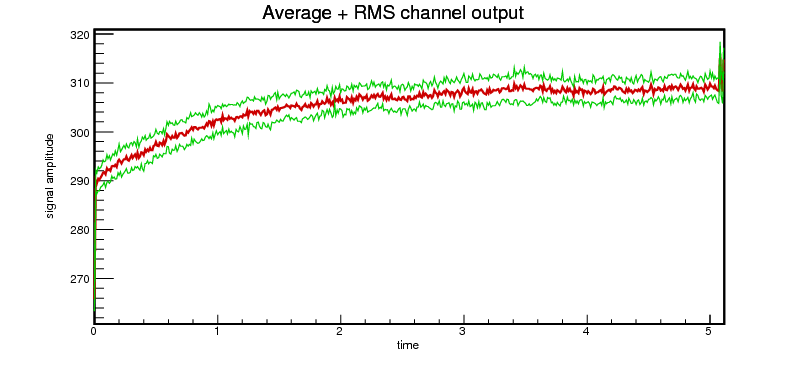
// Plot the results for one channel
// compute the mean sample +/- the RMS
GETSample sample_inf = sample_mean - sample_out;
GETSample sample_sup = sample_mean + sample_out;
// the GETSample is a RRealSampleFFT object (see GFFT documentation)
TGraph * gr_mean = sample_mean.CreateFunctionGraph ( );
gr_mean->SetTitle ( "Average + RMS channel output" );
gr_mean->SetLineColor ( kRed+1 );
gr_mean->SetLineWidth ( 2 );
gr_mean->SetLineStyle ( 1 );
gr_mean->GetXaxis()->SetRangeUser ( 0., (n-1)*dt );
TGraph * gr_inf = sample_inf.CreateFunctionGraph ( );
gr_inf->SetLineColor ( kGreen+1 );
gr_inf->SetLineWidth ( 1 );
gr_inf->SetLineStyle ( 1 );
TGraph * gr_sup = sample_sup.CreateFunctionGraph ( );
gr_sup->SetLineColor ( kGreen+1 );
gr_sup->SetLineWidth ( 1 );
gr_sup->SetLineStyle ( 1 );
TCanvas * canvas = new TCanvas ( "PlotRMS", "PLOTRMS", 800, 400 );
gr_mean->Draw ( "AL" );
gr_inf->Draw ( "L" );
gr_sup->Draw ( "L" );
// create an EPS file
gSystem->mkdir ( "plots", kTRUE );
canvas->SaveAs ( "plots/Demonstrator_RMS2.eps" );
}
}
